Why Beyond 20/20?
Most census data is now freely available to the public via the Statistics Canada website.
Some of the files, however, require Beyond 20/20, software that allows users to manipulate the data. The Topic-based tabulations are a typical example, and are available as HTML files or Beyond 20/20 files.
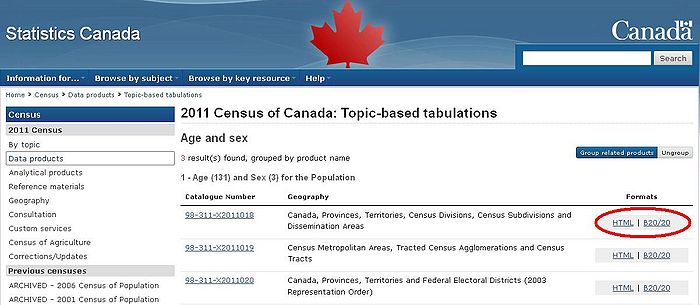
If you want to see all the variables and have control over how you view them, you will need the Beyond 20/20 version.
UBC students also have access via Abacus to more detailed census files that are not publicly available. Some of these files require Beyond 20/20.
Where to get it?
Beyond 20/20 is a free program, and can be downloaded here. It is already installed on all library computers.
Beyond 20/20 allows you to manipulate the data so that you can compare specific variables you are interested in. The data can then be exported into different formats, like an Excel spreadsheet or .csv file.
Definitions
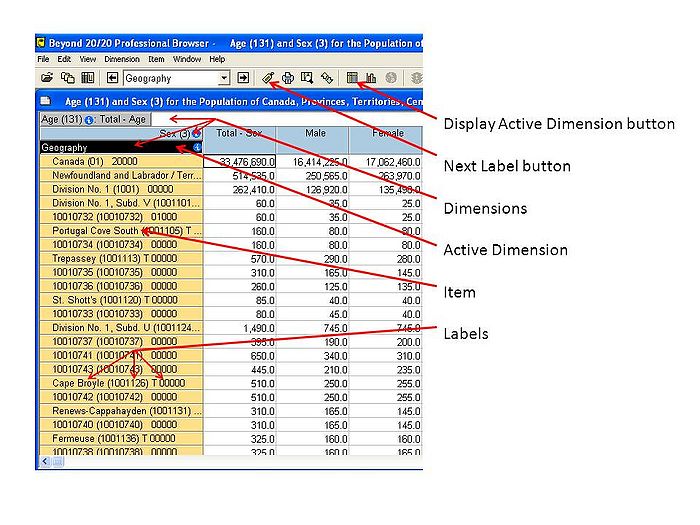
Dimension: Different types, or categories, of data show up as dimensions in Beyond 20/20. This could be something like age, gender, or location. Dimensions correspond to the questions that were asked in the census.
Active dimension: Whichever dimension is currently selected is the active dimension.
Active dimension table: Once you've got a dimension selected, click the Display Active Dimension button to open the active dimension table. Here you can select which items you wish to show or hide.
Item: Items correspond to the possible answers for the questions in the census. Each dimension is made up of items. For example, in the language dimension, French and English would be two of the items. Items show up as either rows or columns in the table, depending on where you place the dimension.
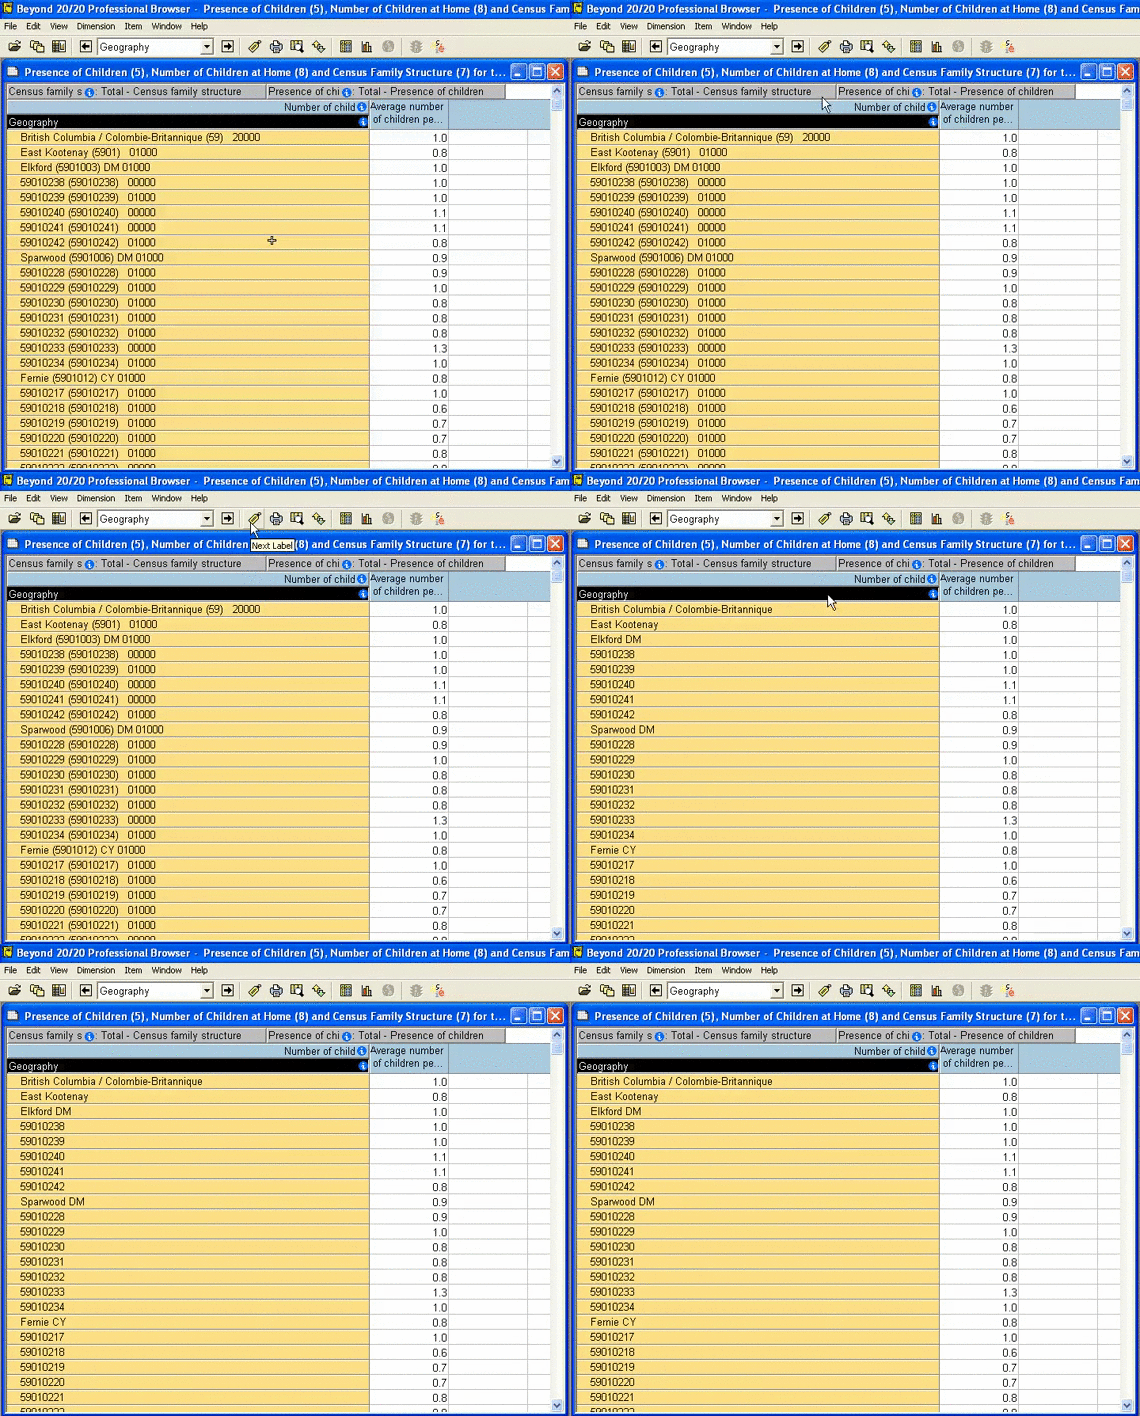
Label: Items can have more than one label, depending on how the data is used. For example, the Geography dimension usually includes place names as well as numerical codes for different geographical areas. The Next Label button will cycle through all the available labels. The active dimension table shows all the labels at once.
Manipulate
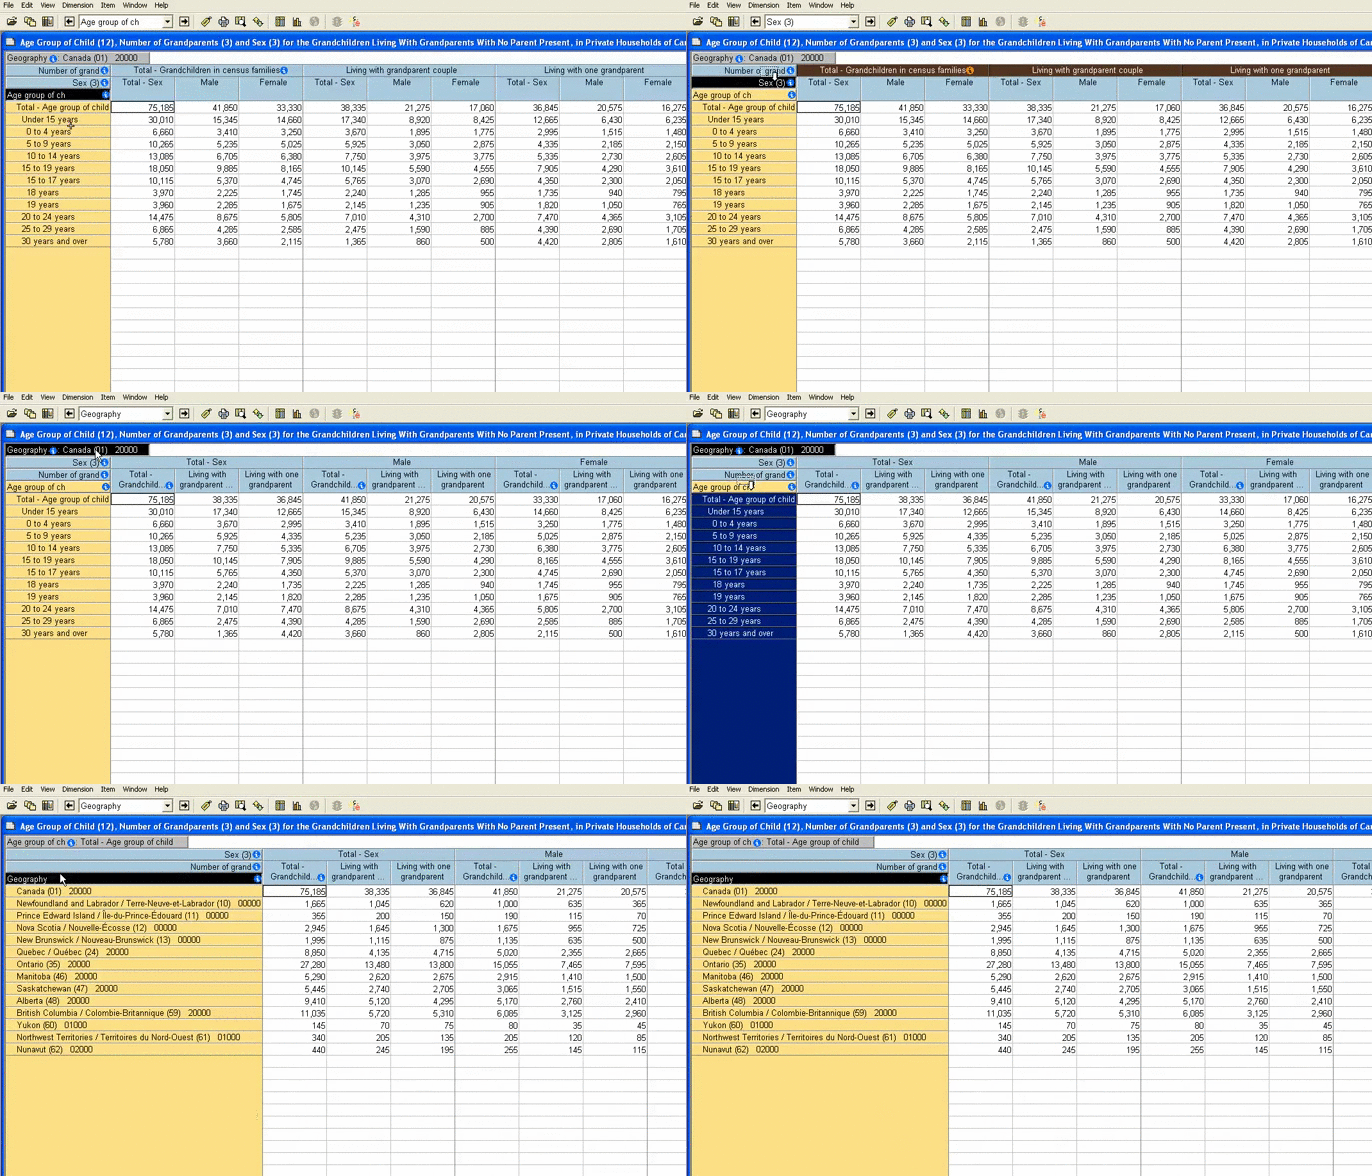
Types of data show up in Beyond 20/20 tables as dimensions. Dimensions can appear either as rows or columns, and include things like gender, age, location and time.
The different colours of the dimension headings tell you what they are doing in the table.
- Yellow dimension headings are in the row position.
- Blue headings are in the column position.
- Grey headings at the top are not currently in the table.
- Black highlights whichever dimension is currently selected, or the active dimension.
- You can drag dimensions around to put them where you want.
Beyond 20/20 lets you stack several dimensions in columns, but only allows one dimension for rows.
B20/20 tables open with only two dimensions showing, even if more dimensions are available. The available dimensions appear grey in the top bar.
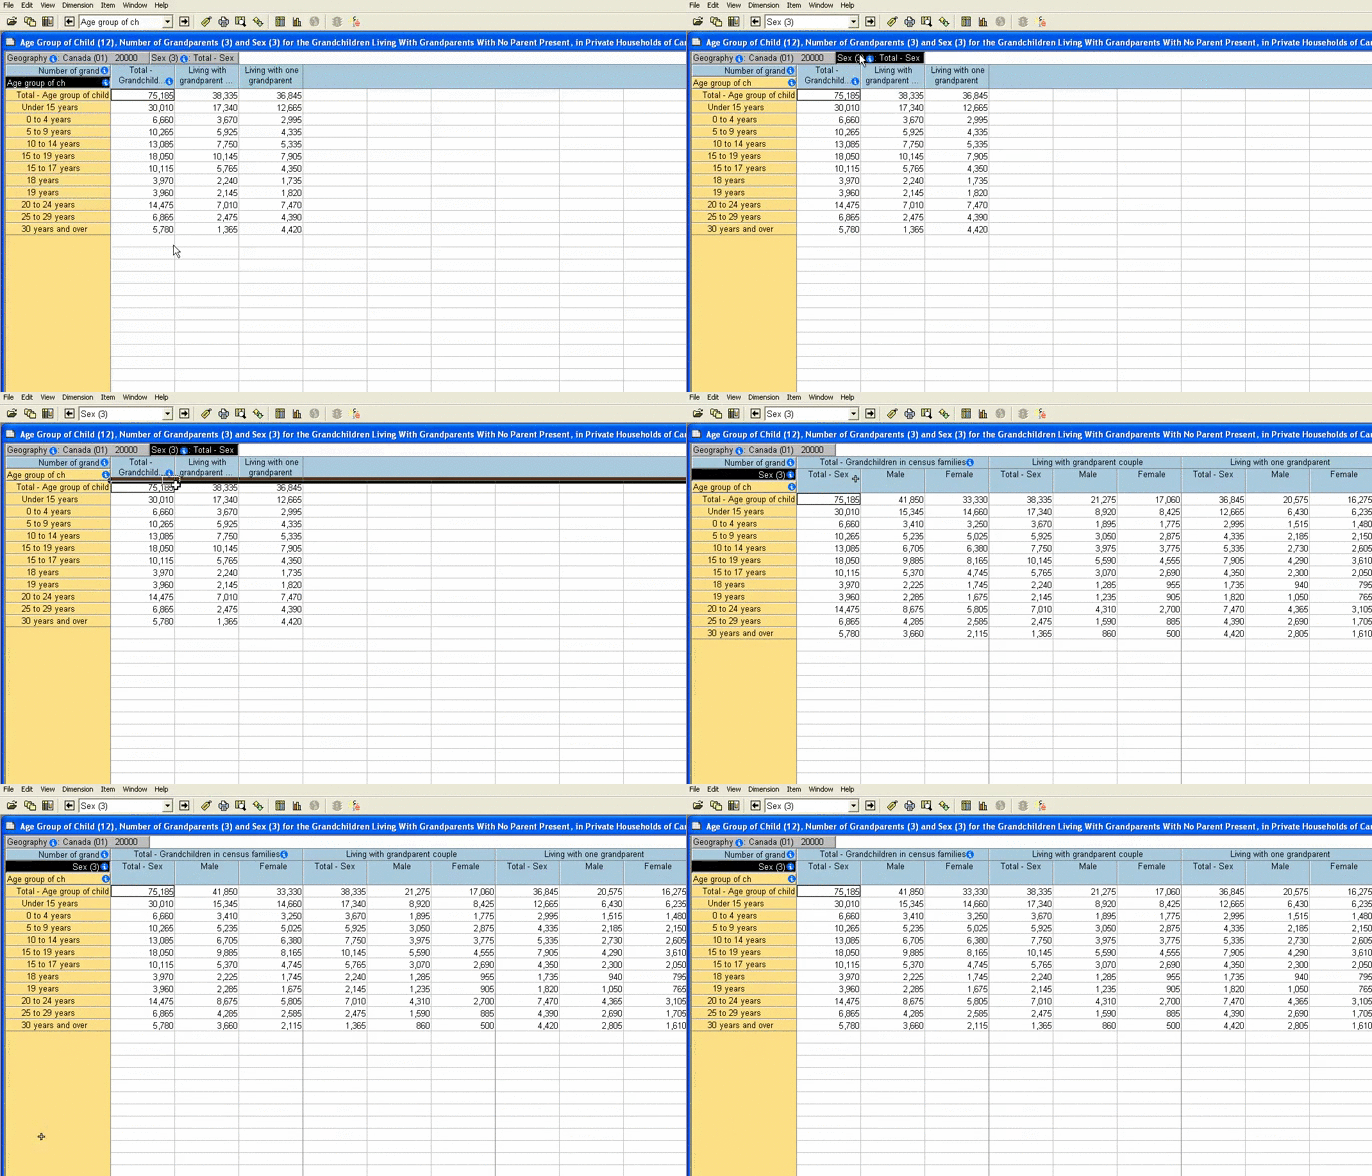
Add a dimension
Drag the dimension you wish to add onto the table. Make sure you see the bold highlight bar and then drop it on the table.
Remove a dimension
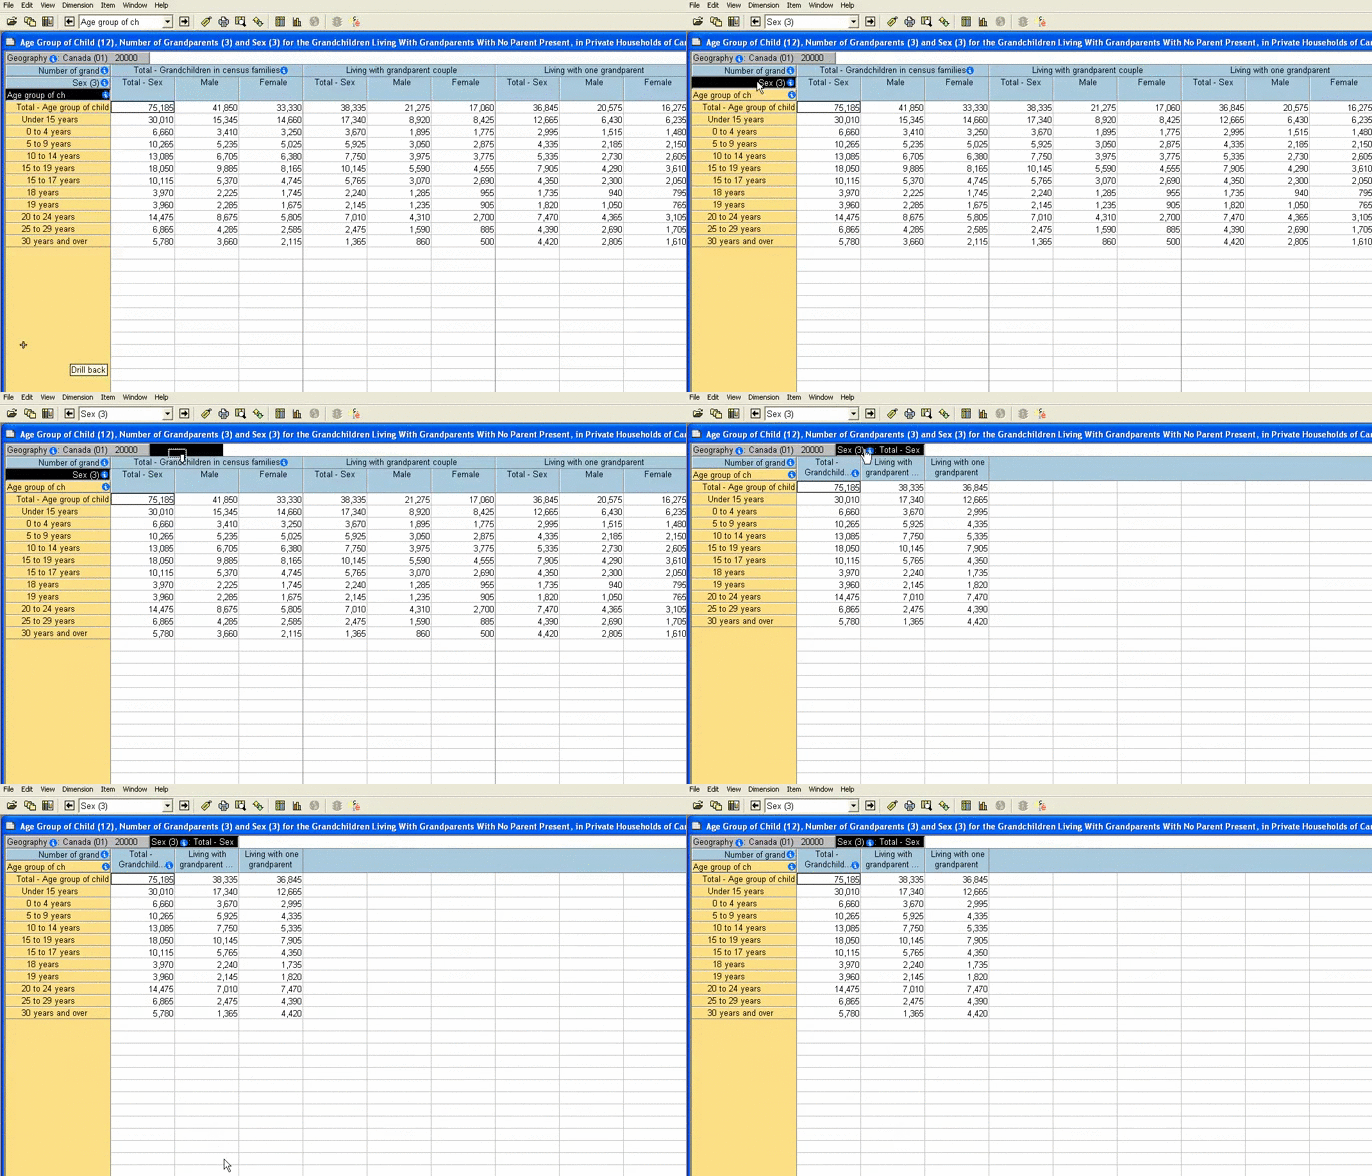
Drag unwanted dimensions from the table up into the white bar above.
Switch the places of dimensions
If you drag one dimension onto another, they will switch positions. This works for switching between columns and rows, and also for switching in and out of the table.
Customize
Census of Canada tables contain a lot of data. Some of it may not be relevant to you.
You can use B20/20 to show only the data that you need.
For example, Geographic data:
- Most Census tables include data for Canada, the Provinces, and large metropolitan areas.
- Many tables will also have data for towns and even large neighbourhoods.
You can use B20/20 to show only the geographic areas you are interested in.
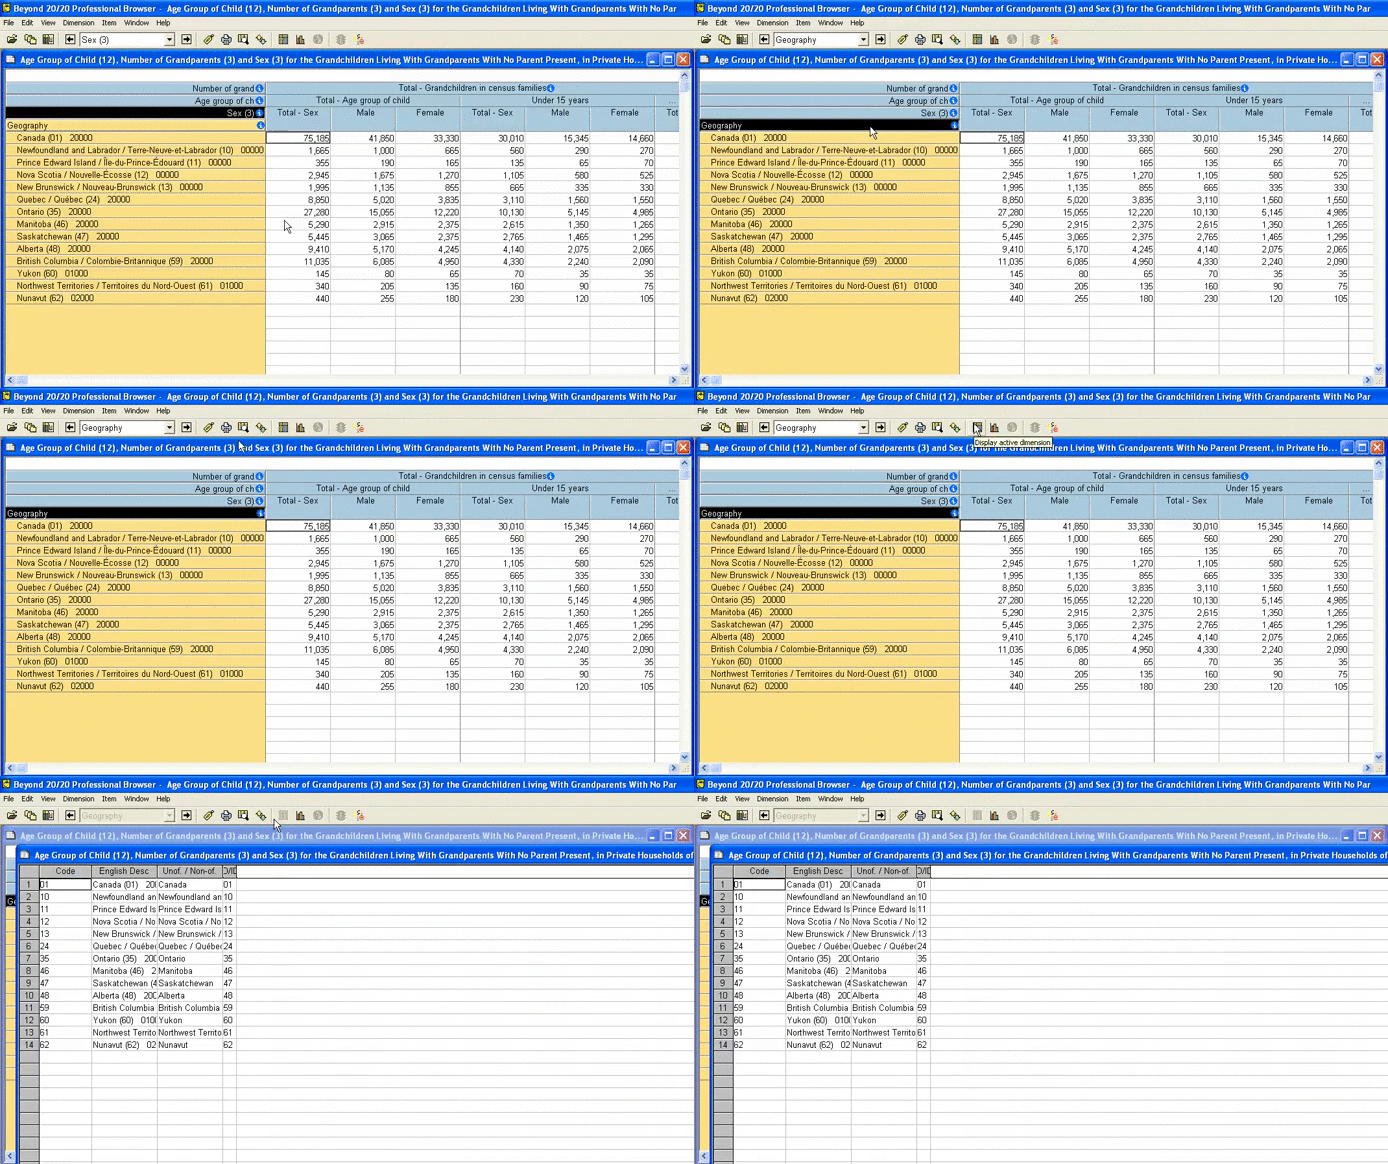
Display the active dimension
- Select the dimension you wish to limit, then click the "Display active dimension" button.
Limit items
The table opens with all the geographic areas that are available.
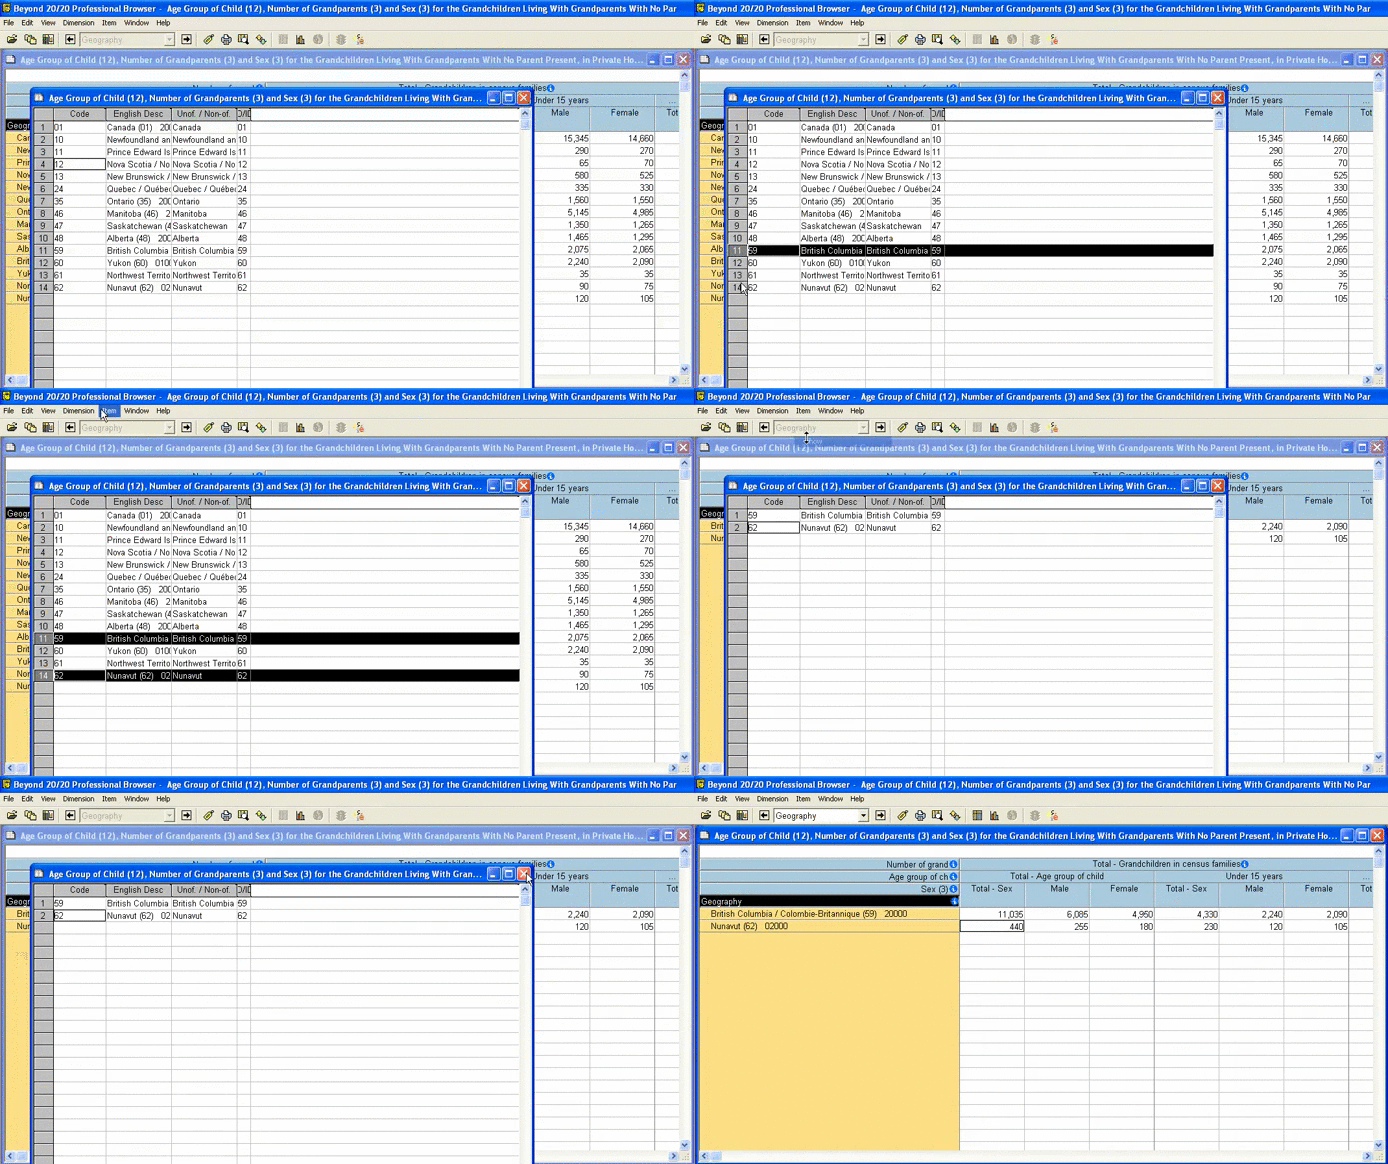
- To limit the data just click on the row(s) that you want.
- Hold down the CTRL button to choose more than one row of data.
- Once you’ve made your selections, click on Item and then Show. Close the active dimension window to return to your table.
Reveal limited items
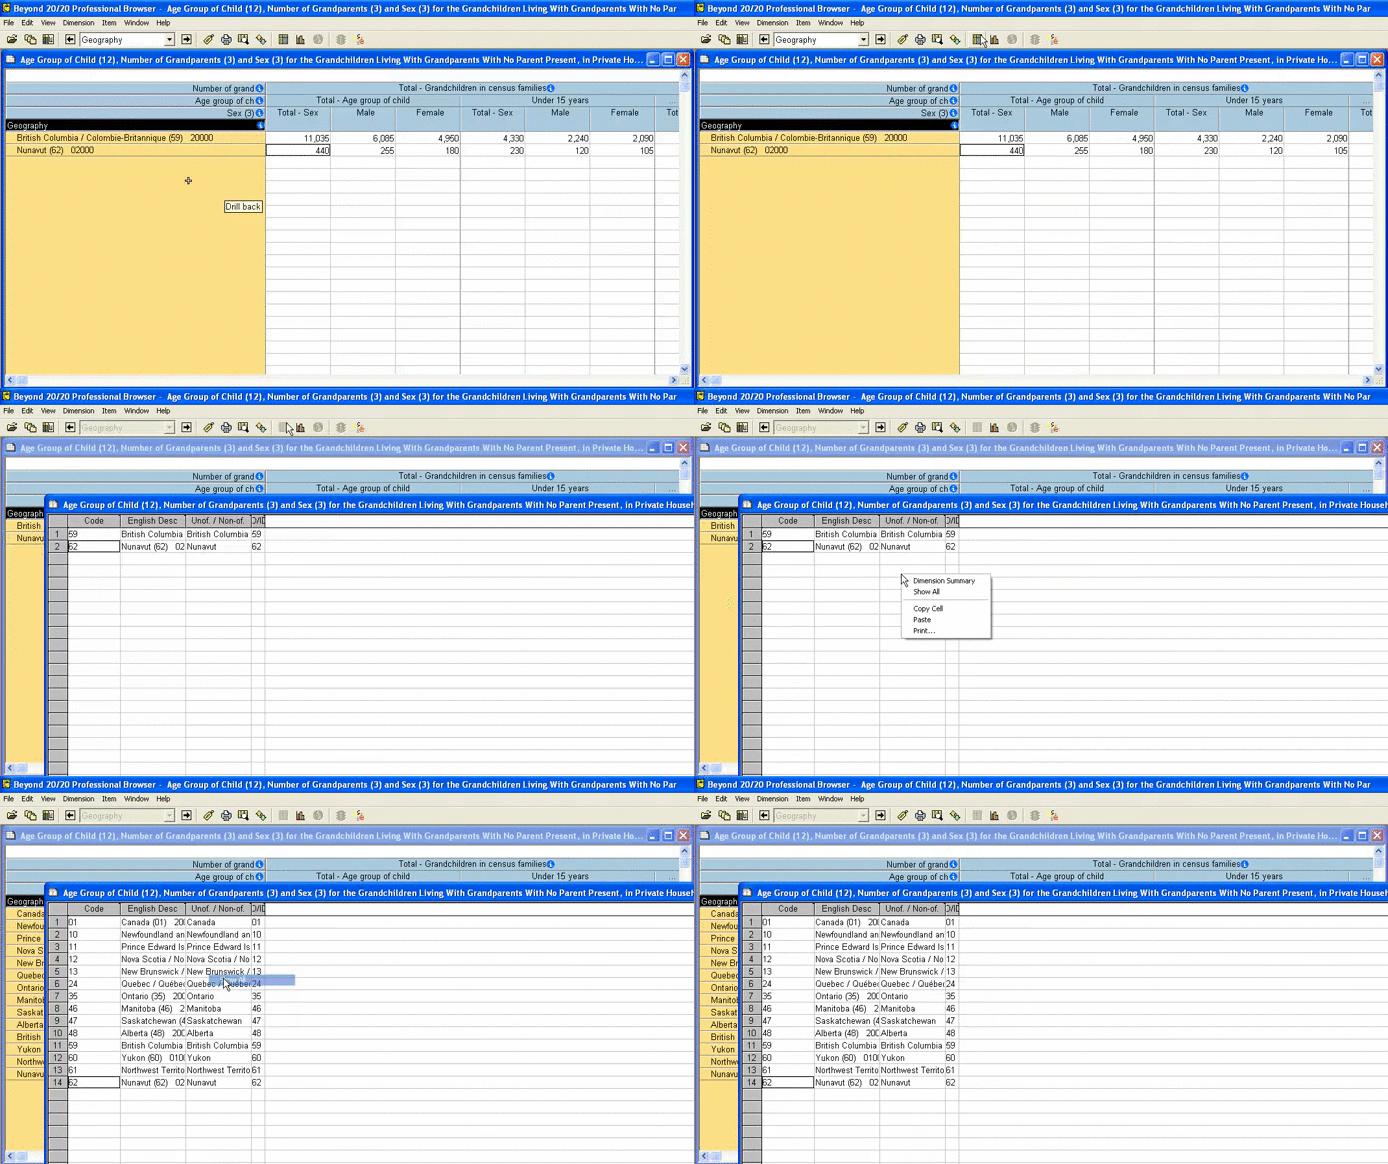
If you want to see all the items again, go back into the active dimension table.
Right-click, and select "Show all"
Change the labels of an active dimension
If you need to use the labels of a dimension to integrate with another program, you may need to change the labels. GIS software, for example, uses an 8-digit code to link the census data in your Beyond 20/20 file to the shapefiles. See this guide for more information on using Census data with GIS.
- Select the dimension you wish to change.
- Click the "Next Label" button.
- The labels now show only the 8-digit codes, with names displayed for the larger regions. Save your file like this if you need to link it to GIS shapefiles.
- If you need to get back to the original labels, keep clicking "Next Label" through the other options until you are back at the start.
Save
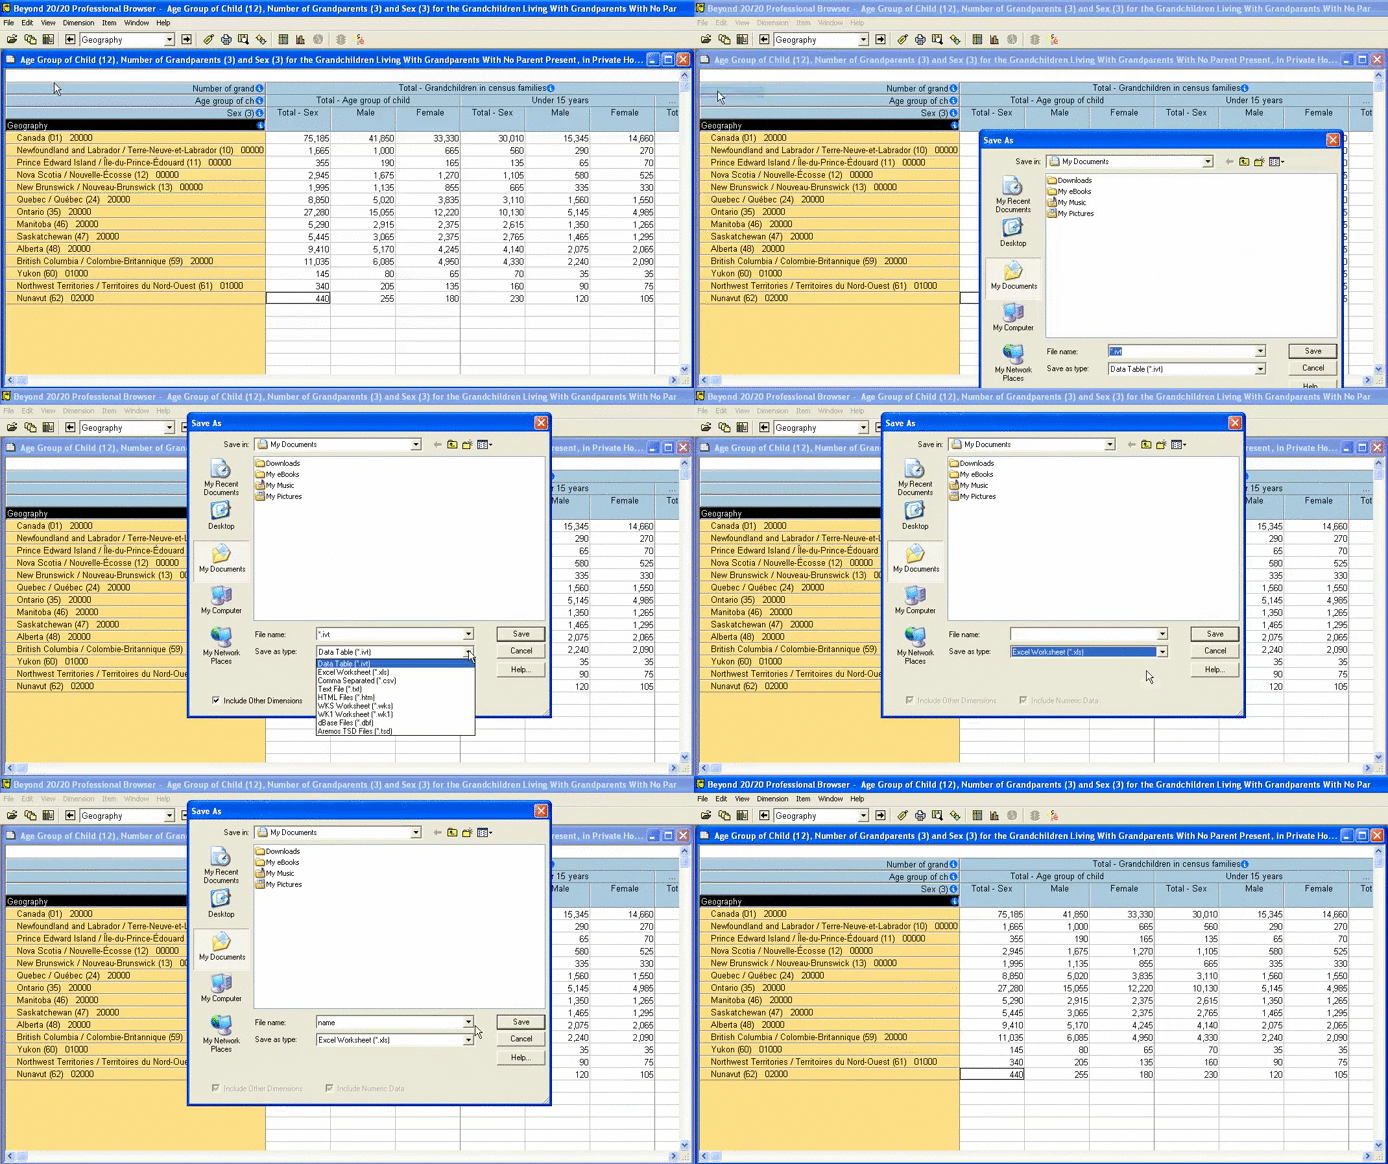
You can save your custom table in a variety of formats, including
Including data files (.ivt), comma separated value files (.csv), and Excel files (.xls)
First, make sure all the dimensions you want to save are showing in the table.
Dimensions left outside the B20/20 table will not appear in your saved table.
- To save the table go to the File menu and click Save As.
- From the Save As Type menu choose the file type you want.
- Choose a name for your file and enter it into the File name box.
Once you have saved your file, open it and check to make sure it’s complete.
